 Time is part of the Project Management Golden Triangle. I have blogged
about the Golden Triangle before, but the concept is that you have Time, Scope
and Quality, as three sides to a triangle and they all impact each other. If you extend one side of the triangle, one
or both of the other two sides will be impacted.
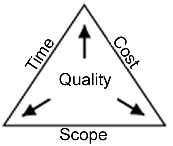
Time is part of the Project Management Golden Triangle. I have blogged
about the Golden Triangle before, but the concept is that you have Time, Scope
and Quality, as three sides to a triangle and they all impact each other. If you extend one side of the triangle, one
or both of the other two sides will be impacted.
Time is an important aspect of Project Management. People who understand scheduling will understand
how simple and how complicated time planning can be. On larger projects, the project plan will be
controlling many different work streams in parallel and the Project Manager
needs to understand the impact of time on each of the work streams and
resources.
Some projects are time critical, such as
running the Olympics in 2012. This had a
defined milestone, the Start Date of the Games.
This becomes the End Date of the project, as everything had to be
complete before this time. This is an example
of a project where the Time cannot be moved.
In some other projects, the Time might not be
so important. It might be that the
project can be slightly delayed, but the quality must be 100%. An example of this would be a NASA space
project, where the quality is of utmost importance, but the budget and time
constraints maybe be flexible, to ensure Quality.
Project Plans, such as Gantt chart, set time expectations. They are estimates of when tasks will be
performed and resources that are required to perform each task. The Gantt chart shows the interdependencies of
the tasks and graphically shows the timeline for the project. Every Project Manager will know that the
Gantt chart can never be fixed and requires room for flexing. A baseline Gantt chart can be confirmed at
the beginning of the project and changes can be tracked to show progress against
the plan.
The Gantt chart is based on estimates. Estimates can impact costs and resource
allocations. If a resource was due to
start on a particular date, but the preceding dependant task is not complete,
then there will be a delay in the resource requirement, which can impact on
costs due to idle time.
Some items that
impact time in the real world are easily forgotten and are rarely planned. Humans are difficult to control, as many
Project Managers will understand.
Project Managers need to ensure their plans include additional time
within the project for the events that are often overlooked, such as sickness,
meetings, quality, rework, other high priority projects taking resources, reporting
and communicating. All of these examples
take up resource time and are difficult to estimate.
Time planning is a challenge, but it can be simplified
by following a simple rule of thumb.
Before I plan anything, I define the scope. This is to ensure that I know WHAT the plan
will achieve. Next, I need to understand
the time constraints, or the WHEN of the plan.
It might be that the start date has to be after a certain date, or that
the project must finish before a certain date.
The final stage of preparation is the WHO. I need to know what resources, be it a
machine or a human, will perform the tasks.
Once you understand all three of these constraints, the What, When and
Who, you can start planning the project.
As soon as you start creating the Gantt
chart, stakeholders can start to visualise the project and understand the
resource capacity. You can find the
bottlenecks and see the critical path, or produce a Network diagram. Once you start seeing when tasks are expected
to be completed, you will add the milestones and start to produce a high level
account to communicate to your management, or Project Steering Group. The Gantt chart can be used to define the
details and ensure your team leaders can see their own work packages and
resource requirements.
The beginning of the project, usually this
planning stage, is my favourite time within the project life-cycle. I enjoy understanding the Project Requirements
and then working out who and how the project will be completed.
I find a burn chart often more important than a Gannt chart. While the Gannt chart nicely shows dependencies, it doesn't as clear communicate impact of change requests (changed specs, new insights in task size) and their moving away of the dealine.
ReplyDeleteI like the idea of a burn down chart, but I think for the infrastructure projects (that I specialise in), it is more suitable just to have a Gantt. I can see the prospect of using a burn down chart quite useful and I wonder if will work for a more traditional (waterfall) approach project?
ReplyDelete